UW Interactive Data Lab
papers

Authoring Narrative Visualizations with Ellipsis
Computer Graphics Forum (Proc. EuroVis), 2014

Materials
Abstract
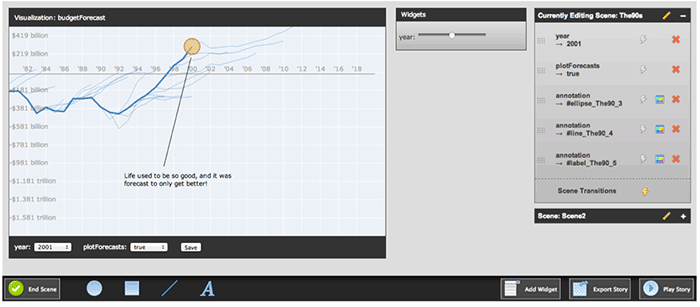
Data visualization is now a popular medium for journalistic storytelling. However, current visualization tools either lack support for storytelling or require significant technical expertise. Informed by interviews with journalists, we introduce a model of storytelling abstractions that includes state-based scene structure, dynamic annotations and decoupled coordination of multiple visualization components. We instantiate our model in Ellipsis: a system that combines a domain-specific language (DSL) for storytelling with a graphical interface for story authoring. User interactions are automatically translated into statements in the Ellipsis DSL. By enabling storytelling without programming, the Ellipsis interface lowers the threshold for authoring narrative visualizations. We evaluate Ellipsis through example applications and user studies with award-winning journalists. Study participants find Ellipsis to be a valuable prototyping tool that can empower journalists in the creation of interactive narratives.
BibTeX
@article{2014-ellipsis,
  title = {Authoring Narrative Visualizations with Ellipsis},
  author = {Satyanarayan, Arvind AND Heer, Jeffrey},
  journal = {Computer Graphics Forum (Proc. EuroVis)},
  year = {2014},
  url = {https://idl.uw.edu/papers/ellipsis},
  doi = {10.1111/cgf.12392}
}
