UW Interactive Data Lab
papers
Cinematic Techniques in Narrative Visualization
arXiv, 2023
Materials
Abstract
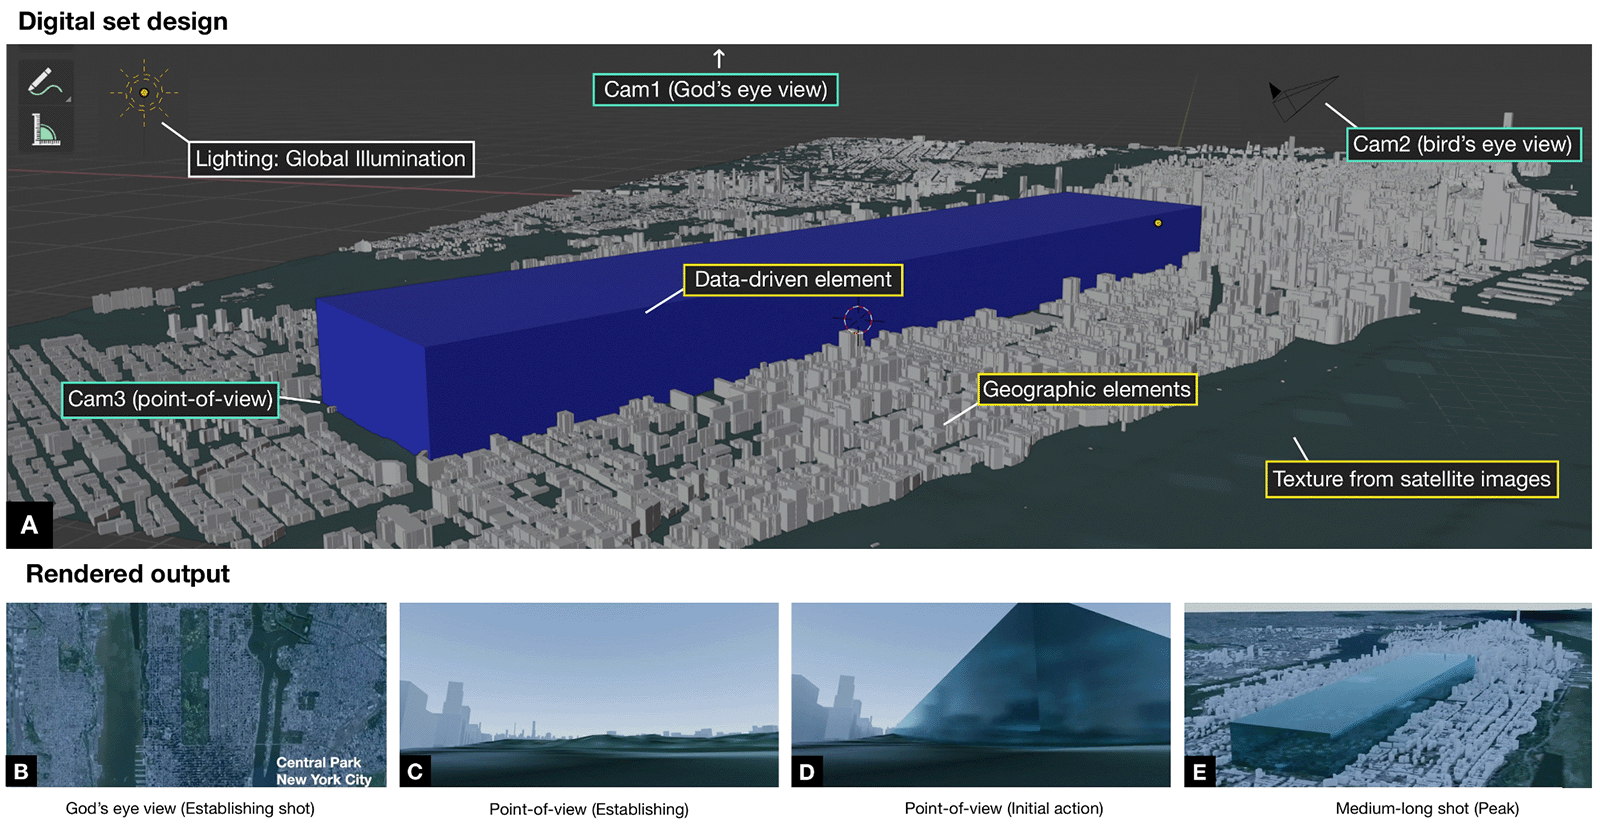
The many genres of narrative visualization (e.g. data comics, data videos) each offer a unique set of affordances and constraints. To better understand a genre that we call cinematic visualizations-3D visualizations that make highly deliberate use of a camera to convey a narrative-we gathered 50 examples and analyzed their traditional cinematic aspects to identify the benefits and limitations of the form. While the cinematic visualization approach can violate traditional rules of visualization, we find that through careful control of the camera, cinematic visualizations enable immersion in data-driven, anthropocentric environments, and can naturally incorporate in-situ narrators, concrete scales, and visual analogies. Our analysis guides our design of a series of cinematic visualizations, created for NASA's Earth Science Communications team. We present one as a case study to convey design guidelines covering cinematography, lighting, set design, and sound, and discuss challenges in creating cinematic visualizations.
BibTeX
@article{2023-cinematic-visualization,
  title = {Cinematic Techniques in Narrative Visualization},
  author = {Conlen, Matt AND Heer, Jeffrey AND Mushkin, Hillary AND Davidoff, Scott},
  journal = {arXiv},
  year = {2023},
  publisher = {arXiv},
  url = {https://idl.uw.edu/papers/cinematic-visualization},
  doi = {10.48550/arXiv.2301.03109}
}