UW Interactive Data Lab
papers

Beyond Weber's Law: A Second Look at Ranking Visualizations of Correlation
Matthew Kay, Jeffrey Heer.
IEEE Trans. Visualization & Comp. Graphics (Proc. InfoVis), 2016
Matthew Kay, Jeffrey Heer
IEEE Trans. Visualization & Comp. Graphics (Proc. InfoVis), 2016

Abstract
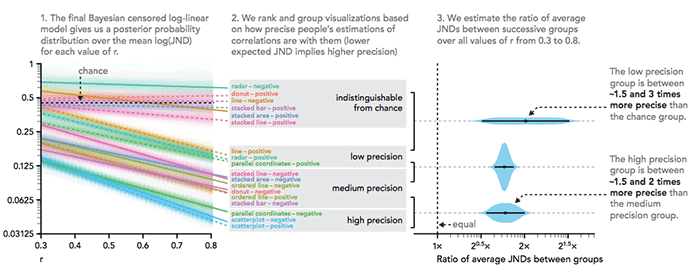
Models of human perception - including perceptual "laws" - can be valuable tools for deriving visualization design recommendations. However, it is important to assess the explanatory power of such models when using them to inform design. We present a secondary analysis of data previously used to rank the effectiveness of bivariate visualizations for assessing correlation (measured with Pearson's r) according to the well-known Weber-Fechner Law. Beginning with the model of Harrison et al. [1], we present a sequence of refinements including incorporation of individual differences, log transformation, censored regression, and adoption of Bayesian statistics. Our model incorporates all observations dropped from the original analysis, including data near ceilings caused by the data collection process and entire visualizations dropped due to large numbers of observations worse than chance. This model deviates from Weber's Law, but provides improved predictive accuracy and generalization. Using Bayesian credibility intervals, we derive a partial ranking that groups visualizations with similar performance, and we give precise estimates of the difference in performance between these groups. We find that compared to other visualizations, scatterplots are unique in combining low variance between individuals and high precision on both positively- and negatively- correlated data. We conclude with a discussion of the value of data sharing and replication, and share implications for modeling similar experimental data.
BibTeX
@article{2016-beyond-webers-law,
  title = {Beyond Weber's Law: A Second Look at Ranking Visualizations of Correlation},
  author = {Kay, Matthew AND Heer, Jeffrey},
  journal = {IEEE Trans. Visualization \& Comp. Graphics (Proc. InfoVis)},
  year = {2016},
  url = {https://idl.uw.edu/papers/beyond-webers-law},
  doi = {10.1109/TVCG.2015.2467671}
}
